Nočnica Mellifera
Hands on with OpenTelemetry
#1about 3 minutes
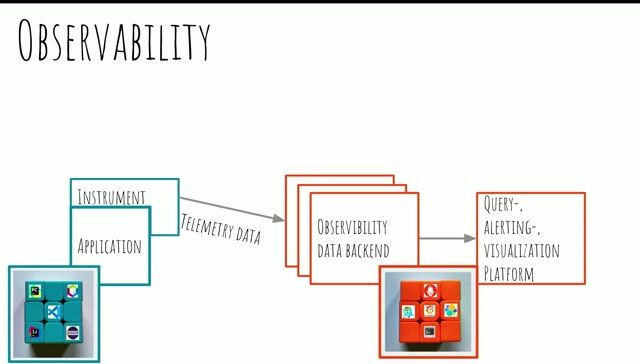
Defining observability as time to understanding
Observability is defined as the time it takes to understand a problem, which is crucial for reducing stress and resolving issues effectively.
#2about 4 minutes
Why modern microservice architectures are harder to observe
The shift from monolithic systems to complex microservice environments has made it more difficult to have a complete understanding of system behavior.
#3about 3 minutes
Introducing OpenTelemetry and its collector architecture
OpenTelemetry provides an open standard and tools, centered around a collector, to gather and process telemetry data from various services.
#4about 9 minutes
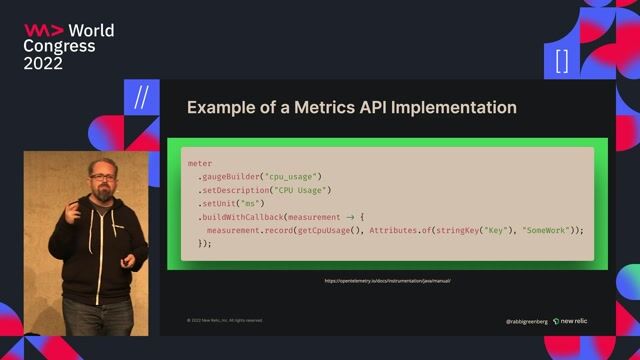
The three core signals: metrics, logs, and traces
An overview of the three pillars of observability, explaining how metrics provide high-level views, logs offer detailed events, and traces show request flows.
#5about 5 minutes
Managing the challenges of high cardinality data
High cardinality data, such as including user IDs in metric names, can explode storage costs and make it difficult to identify meaningful patterns.
#6about 4 minutes
Filtering telemetry data without changing application code
The OpenTelemetry collector allows for filtering sensitive or noisy data without requiring modifications to the application's source code.
#7about 5 minutes
Understanding the collector's processing pipeline
The collector uses a pipeline of receivers, processors, and exporters to ingest, transform, and send telemetry data to various backends.
#8about 3 minutes
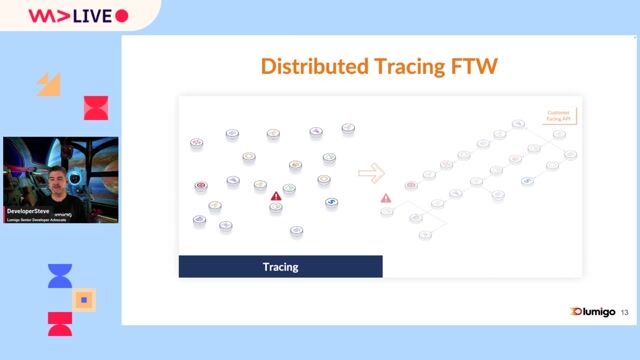
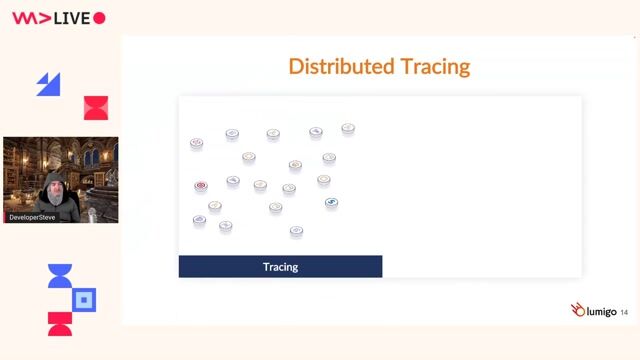
How distributed tracing and baggage work together
Distributed tracing connects spans across services using propagated headers, and baggage allows for passing additional business context along with the request.
#9about 6 minutes
Understanding the scope of the OpenTelemetry project
OpenTelemetry focuses on data generation and collection, intentionally not providing data storage, dashboards, notifications, or synthetic monitoring.
#10about 1 minute
Customizing the collector's behavior with YAML configuration
The collector's YAML configuration file is used to define pipelines for filtering data, normalizing labels, and routing telemetry to different destinations.
#11about 3 minutes
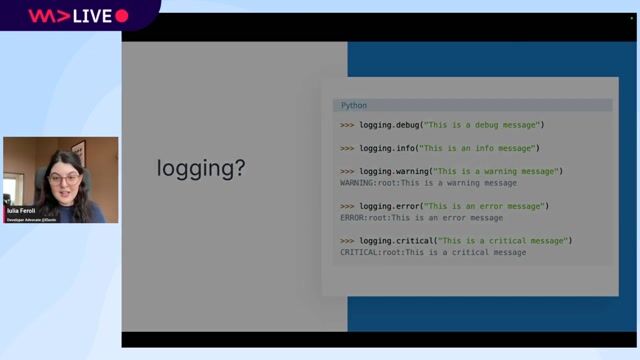
Best practices for sending logs through the collector
When sending logs, consider managing log levels, routing logs to different backends, and decorating them with trace IDs for better correlation.
#12about 2 minutes
Discussing the downsides of OpenTelemetry
Potential downsides include varying quality of automatic instrumentation and vendor support, with features like the transform language (OTTL) still maturing.
#13about 5 minutes
Integrating OpenTelemetry with other monitoring tools
The collector can ingest data from various sources, but it is important to verify how well downstream tools actually support and display OpenTelemetry data.
Related jobs
Jobs that call for the skills explored in this talk.
Matching moments
03:19 MIN
How the OpenTelemetry data pipeline works
Telemetry without the 'Tool Tax'
Unlock Moments
Create a free account to watch a limited number of Moments each month.
Upgrade to PRO for unlimited access to the full archive.
Upgrade to PRO for unlimited access to the full archive.
You have an account? Log in
02:15 MIN
Standardizing telemetry collection with OpenTelemetry
Handling incidents collaboratively is like solving a rubix cube
Unlock Moments
Create a free account to watch a limited number of Moments each month.
Upgrade to PRO for unlimited access to the full archive.
Upgrade to PRO for unlimited access to the full archive.
You have an account? Log in
04:17 MIN
Solving monitoring challenges with OpenTelemetry
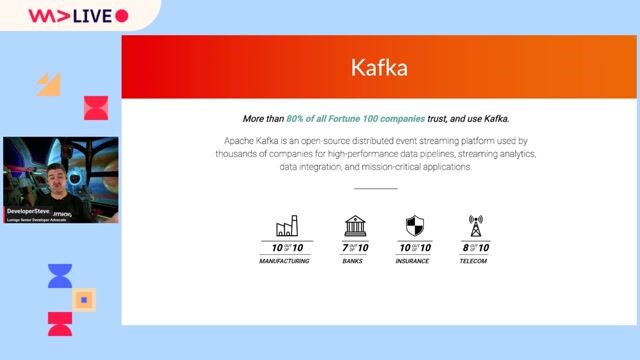
Tips, Techniques, and Common Pitfalls Debugging Kafka
Unlock Moments
Create a free account to watch a limited number of Moments each month.
Upgrade to PRO for unlimited access to the full archive.
Upgrade to PRO for unlimited access to the full archive.
You have an account? Log in
04:44 MIN
Introducing OpenTelemetry as a universal standard
Observability with OpenTelemetry & Elastic
Unlock Moments
Create a free account to watch a limited number of Moments each month.
Upgrade to PRO for unlimited access to the full archive.
Upgrade to PRO for unlimited access to the full archive.
You have an account? Log in

01:59 MIN
Why OpenTelemetry matters for modern DevOps teams
Telemetry without the 'Tool Tax'
Unlock Moments
Create a free account to watch a limited number of Moments each month.
Upgrade to PRO for unlimited access to the full archive.
Upgrade to PRO for unlimited access to the full archive.
You have an account? Log in
07:54 MIN
Solving cloud debugging with OpenTelemetry distributed tracing
Debugging Schrödinger's App
Unlock Moments
Create a free account to watch a limited number of Moments each month.
Upgrade to PRO for unlimited access to the full archive.
Upgrade to PRO for unlimited access to the full archive.
You have an account? Log in
03:32 MIN
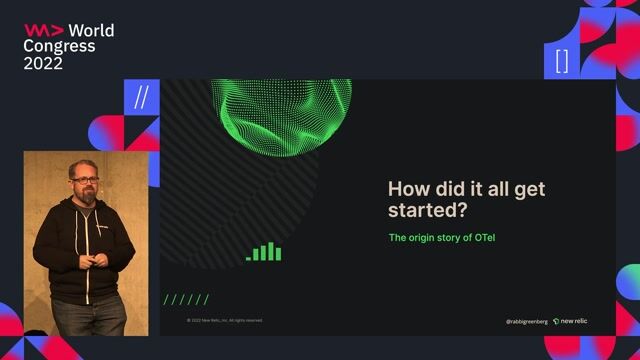
Understanding the origin story of OpenTelemetry
Telemetry without the 'Tool Tax'
Unlock Moments
Create a free account to watch a limited number of Moments each month.
Upgrade to PRO for unlimited access to the full archive.
Upgrade to PRO for unlimited access to the full archive.
You have an account? Log in
03:25 MIN
Owning and exporting your telemetry data with OTel
Telemetry without the 'Tool Tax'
Unlock Moments
Create a free account to watch a limited number of Moments each month.
Upgrade to PRO for unlimited access to the full archive.
Upgrade to PRO for unlimited access to the full archive.
You have an account? Log in
Featured Partners
Related Videos
 30:29
30:29Observability with OpenTelemetry & Elastic
Iulia Feroli
 54:29
54:29Tips, Techniques, and Common Pitfalls Debugging Kafka
DeveloperSteve
 56:51
56:51Debugging Schrödinger's App
DeveloperSteve Coochin
 24:30
24:30Telemetry without the 'Tool Tax'
Ben Greenberg
 03:37
03:37Startup Presentation: Observability-driven development with OpenTelemetry
Adnan Rahić
 50:38
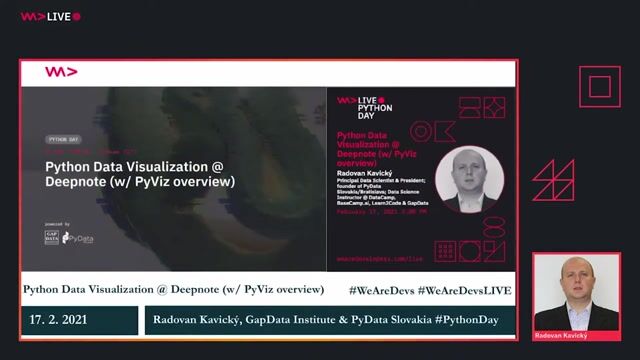
50:38Python Data Visualization @ Deepnote (w/ PyViz overview)
Radovan Kavický
 2:01:25
All your telemetry data from any source in one place
Liam Hurrell
 32:47
32:47Monitoring as Code - Managing your dashboards at scale
Gabriel Labachelerie
Related Articles
View all articles


From learning to earning
Jobs that call for the skills explored in this talk.

SYSKRON GmbH
Regensburg, Germany
Intermediate
Senior
.NET
Python
Kubernetes
AUTO1 Group SE
Berlin, Germany
Intermediate
Senior
ELK
Terraform
Elasticsearch