Iulia Feroli
Observability with OpenTelemetry & Elastic
#1about 1 minute
The growing need for observability in complex applications
Modern applications with many moving parts, like those in the GenAI space, require robust monitoring to diagnose and fix issues effectively.
#2about 4 minutes
Moving beyond print statements for Python monitoring
While print() statements are a common starting point for debugging, Python's native logging module offers a more structured, albeit limited, approach.
#3about 5 minutes
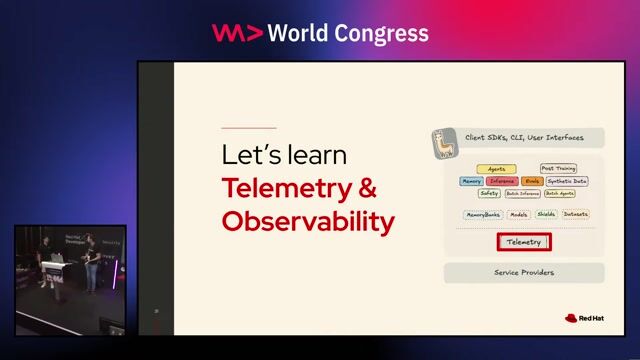
Introducing OpenTelemetry as a universal standard
OpenTelemetry provides a vendor-agnostic, open-source framework for instrumenting applications to emit telemetry data for analysis.
#4about 7 minutes
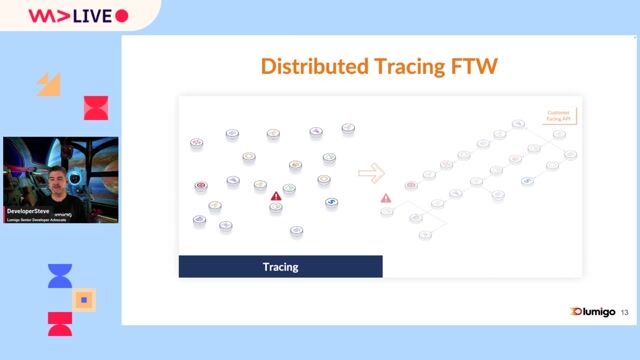
Exploring the three main signals: traces, metrics, and logs
Observability is built on three core signal types: traces for request paths, metrics for numerical data, and logs for event records.
#5about 5 minutes
Using manual and automatic instrumentation in your code
You can add OpenTelemetry to your application by manually inserting code snippets or by using automatic instrumentation for common libraries and frameworks.
#6about 3 minutes
Combining OpenTelemetry data with the Elastic stack
Elastic natively supports the OpenTelemetry protocol and schema, allowing you to collect, store, and visualize telemetry data in a centralized platform.
#7about 3 minutes
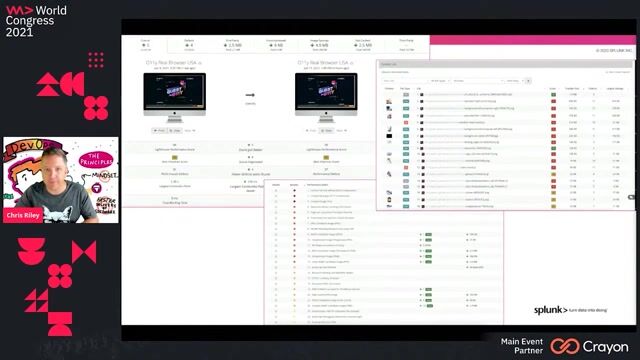
Visualizing application performance with an Elastic dashboard
A live demonstration shows how an OpenTelemetry-instrumented application sends data to Elastic, revealing metrics like latency, throughput, errors, and logs.
#8about 2 minutes
Why observability is critical for Python and AI applications
Adopting observability standards like OpenTelemetry is crucial for Python developers to monitor, debug, and optimize increasingly complex AI and LLM-based systems.
Related jobs
Jobs that call for the skills explored in this talk.
Matching moments
05:10 MIN
The developer's role in modern monitoring and observability
What Developers Get Wrong About Application Quality
Unlock Moments
Create a free account to watch a limited number of Moments each month.
Upgrade to PRO for unlimited access to the full archive.
Upgrade to PRO for unlimited access to the full archive.
You have an account? Log in
03:00 MIN
Gaining application observability with built-in telemetry
One AI API to Power Them All
Unlock Moments
Create a free account to watch a limited number of Moments each month.
Upgrade to PRO for unlimited access to the full archive.
Upgrade to PRO for unlimited access to the full archive.
You have an account? Log in
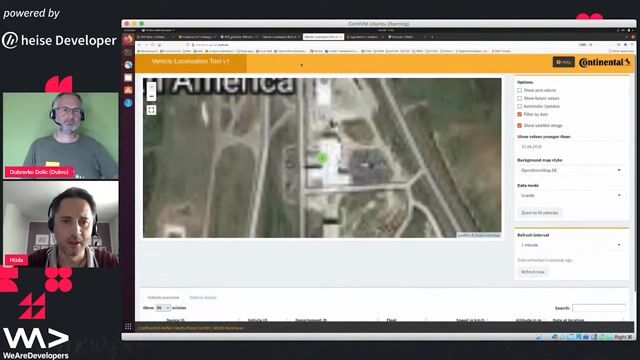
05:35 MIN
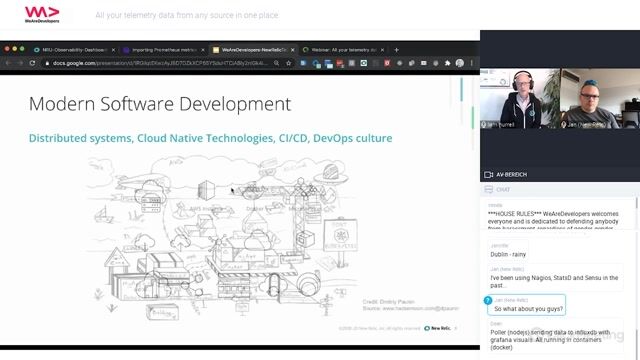
Moving from basic monitoring to full system observability
All your telemetry data from any source in one place
Unlock Moments
Create a free account to watch a limited number of Moments each month.
Upgrade to PRO for unlimited access to the full archive.
Upgrade to PRO for unlimited access to the full archive.
You have an account? Log in
04:17 MIN
Solving monitoring challenges with OpenTelemetry
Tips, Techniques, and Common Pitfalls Debugging Kafka
Unlock Moments
Create a free account to watch a limited number of Moments each month.
Upgrade to PRO for unlimited access to the full archive.
Upgrade to PRO for unlimited access to the full archive.
You have an account? Log in
04:39 MIN
Monitoring applications with logs and metrics
Industrializing your Data Science capabilities
Unlock Moments
Create a free account to watch a limited number of Moments each month.
Upgrade to PRO for unlimited access to the full archive.
Upgrade to PRO for unlimited access to the full archive.
You have an account? Log in
02:37 MIN
Using observability for better business outcomes
Keycloak case study: Making users happy with service level indicators and observability
Unlock Moments
Create a free account to watch a limited number of Moments each month.
Upgrade to PRO for unlimited access to the full archive.
Upgrade to PRO for unlimited access to the full archive.
You have an account? Log in
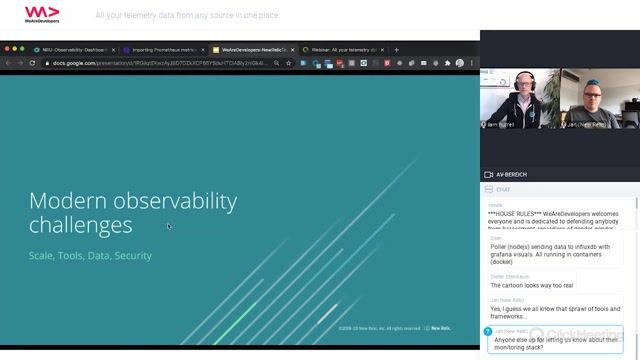
06:29 MIN
Overcoming observability challenges with a unified platform
All your telemetry data from any source in one place
Unlock Moments
Create a free account to watch a limited number of Moments each month.
Upgrade to PRO for unlimited access to the full archive.
Upgrade to PRO for unlimited access to the full archive.
You have an account? Log in

02:25 MIN
Discovering incidents through system observability
Handling incidents collaboratively is like solving a rubix cube
Unlock Moments
Create a free account to watch a limited number of Moments each month.
Upgrade to PRO for unlimited access to the full archive.
Upgrade to PRO for unlimited access to the full archive.
You have an account? Log in
Featured Partners
Related Videos
 53:57
53:57Hands on with OpenTelemetry
Nočnica Mellifera
 56:51
56:51Debugging Schrödinger's App
DeveloperSteve Coochin
 54:29
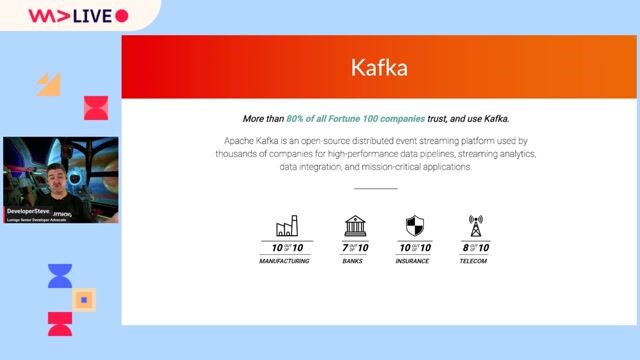
54:29Tips, Techniques, and Common Pitfalls Debugging Kafka
DeveloperSteve
 57:52
57:52Harry Potter and the Elastic Semantic Search
Iulia Feroli
 38:50
38:50Let's Get Started With Apache Kafka® for Python Developers
Lucia Cerchie
 50:38
50:38Python Data Visualization @ Deepnote (w/ PyViz overview)
Radovan Kavický
 24:30
24:30Telemetry without the 'Tool Tax'
Ben Greenberg
 03:37
03:37Startup Presentation: Observability-driven development with OpenTelemetry
Adnan Rahić
Related Articles
View all articles

.webp?w=240&auto=compress,format)

From learning to earning
Jobs that call for the skills explored in this talk.

SYSKRON GmbH
Regensburg, Germany
Intermediate
Senior
.NET
Python
Kubernetes

Peter Park System GmbH
München, Germany
Senior
Python
Docker
Node.js
JavaScript
CONTIAMO GMBH
Berlin, Germany
Senior
Python
Docker
TypeScript
PostgreSQL
AUTO1 Group SE
Berlin, Germany
Intermediate
Senior
ELK
Terraform
Elasticsearch

Ivalua
Canton de Massy, France
Senior
ASP.NET
Grafana
Data analysis
Microsoft SQL Server